
Mar 19, 2018
Identifying the NHL’s most unpredictable teams
The Canucks, Maple Leafs, Wild and Lightning have consistently wilder performance swings than the rest of the league, Travis Yost writes.
By Travis Yost

Every year it seems like there are a handful of NHL teams that are wildly unpredictable. This season is no different.
Last week I joked that, at least to my eye, a trio of Western Conference teams – the Anaheim Ducks, Calgary Flames, and Dallas Stars – were at the top of my unpredictable list. From what I have watched this year, these are the three teams that seem to have completely erratic performance on a game-by-game basis. One night they look like world beaters, and the next night they’re getting caved into the ice.
But eye tests can be misleading for this discussion. All teams have some degree of performance fluctuation and that can be true for a variety of reasons (e.g. unfavourable scheduling stretches, cluster injuries, disadvantageous travel, in-game score effects, penalty differentials and so on). What is true is that the teams that generally rise to the top of the standings can minimize the true number of ‘bad’ games they’ll log over the course of the season. The rest of the league? Not so much.
The discussion did get me curious about team performance on a game-by-game basis this year, and more specifically, which teams tend to have more wild swings and deviations in their play. To measure this, I went and pulled every single game played by each team during the regular season. From there, I took the average shot share (Corsi%) for each team at 5-on-5 and used Corsica’s adjustment for score effects. (Using 5-on-5 data will help smooth out the games where penalty differentials are extremely one-sided, which can skew all situations performance accordingly.)
Here’s what each team has looked like over the course of the season, sorted by standard deviation:
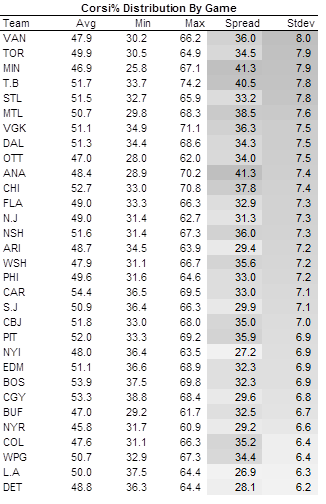
There are two measures there. The spread column effectively shows each team’s best game versus worst game in the current season, where the standard deviation column really measures full season volatility. The good news is I wasn’t wrong about Anaheim or Dallas – both teams rank on the higher end of deviations from their average Corsi%, suggesting their performance is less predictable than your standard NHL team. And Anaheim actually has the biggest spread of any team in the league – they’ve turned in some just truly awful games and some truly fantastic ones, too.
But this is also a great example of why fact checking is a valuable exercise. There are clearly four teams who have consistently wilder performance swings than the rest of the league and none of the teams I initially thought of fall into that group. The real clubhouse leaders are Vancouver, Toronto, Minnesota, and Tampa Bay. (I don’t think St. Louis’ variances are as meaningful, since their strategic pivot mid-year from contender to seller and lottery hopeful is probably causing a large piece of this.)
To get a better look at this, I’ve graphed out each division based on their distribution of performance, and considering two teams near the top of our list fall in the Atlantic Division, let’s start there:
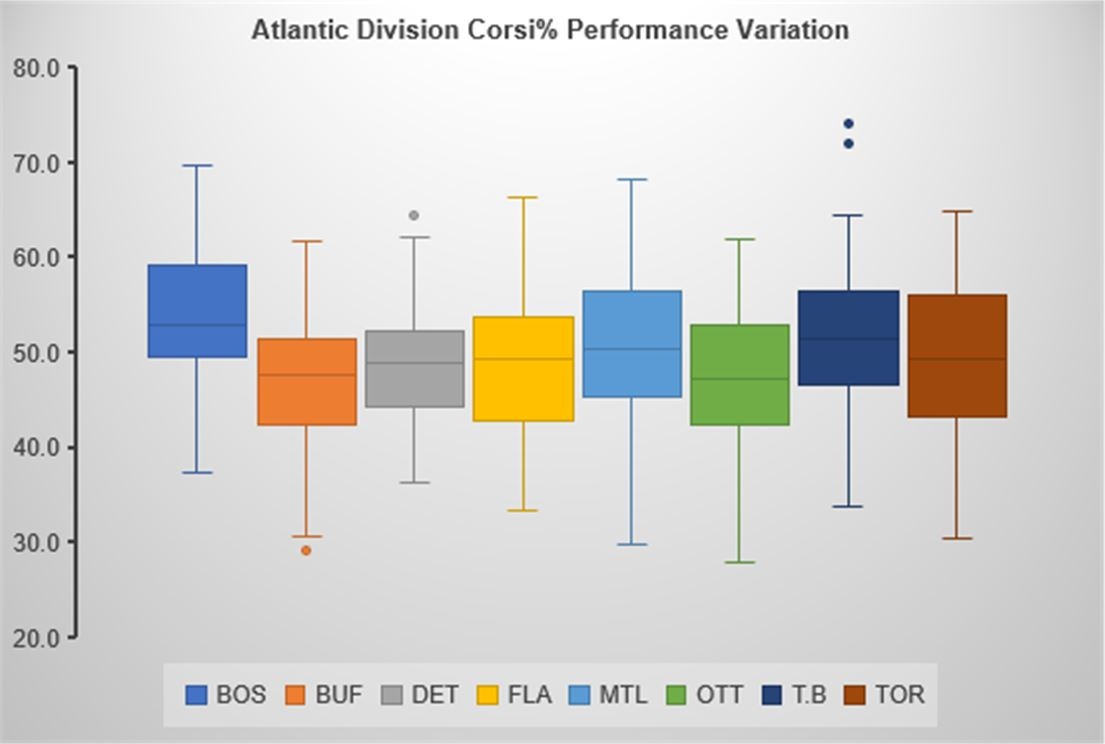
Three things really stand out here. One, this division is extremely top heavy – you have a clear delineation between the great teams (Boston, Tampa Bay and Toronto) and everyone else. Two, this is why showing the full data sets really matters. Tampa Bay and Toronto have similar average performances but it’s only the Leafs who have really turned in a number of stinkers this year (their 25th percentile is barely over 43 per cent). Three, Boston is terrifying and probably the biggest threat to Tampa Bay in the entire Eastern Conference. Their 25th percentile is just about 50 per cent, which means even in their bad performances they are still breaking even in shots.
Tampa Bay’s two outlier points are also a fun story. The two biggest shot advantages any team has posted this season are both by the Bolts and were done in back-to-back games. On Dec. 21, the Lightning outshot Ottawa 54-21, which seems impossibly dominant. And yet two days later they followed it up with a better performance, out-shooting Minnesota 46-16 in the most one-sided game of the 2017-18 season.
Let’s go to the Metro now:
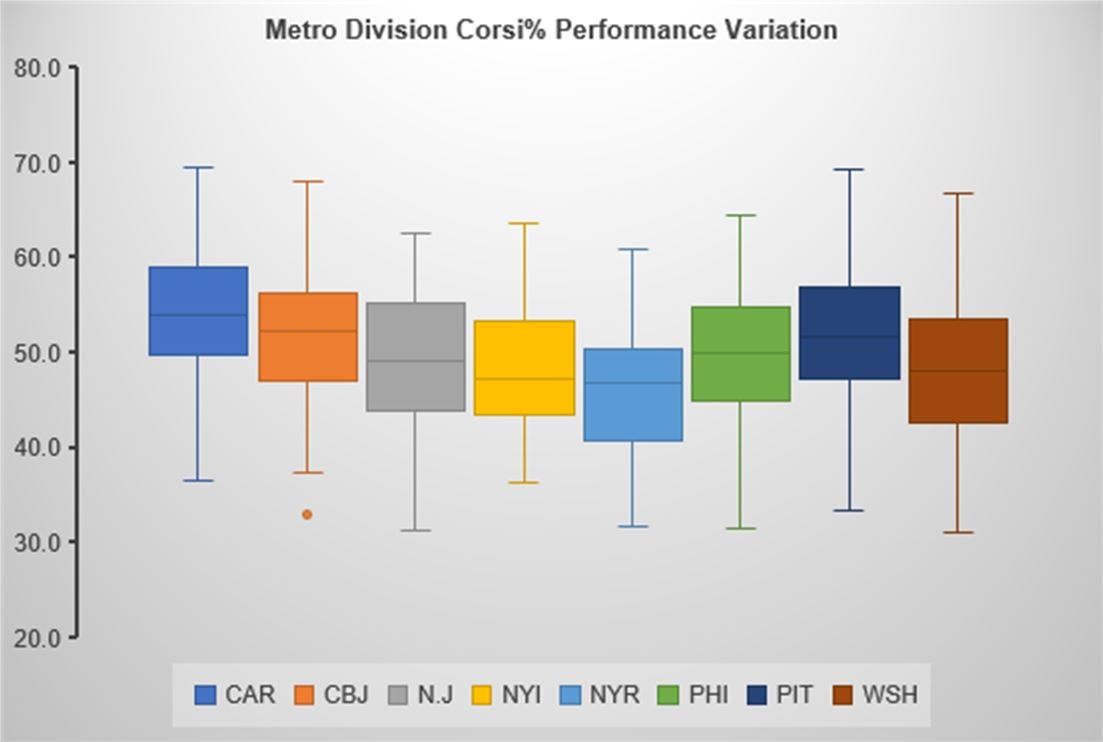
Nothing too significant here, though it’s incredible how Carolina has squandered another season of strong performance by the skaters thanks to just hideous goaltending performance. One thing that’s worth calling out though is that Columbus does look pretty respectable here compared to some of the divisional giants, including Pittsburgh. The Blue Jackets have had rocky stretches during the season but they really have turned it on late – over their last 20 games they’re playing at a 103-point pace with 55 per cent of the shots and 55 per cent of the goals. It’s something to keep an eye on as we continue to work towards separating the contender from the pretenders in an extremely competitive division.
Over to the Central:
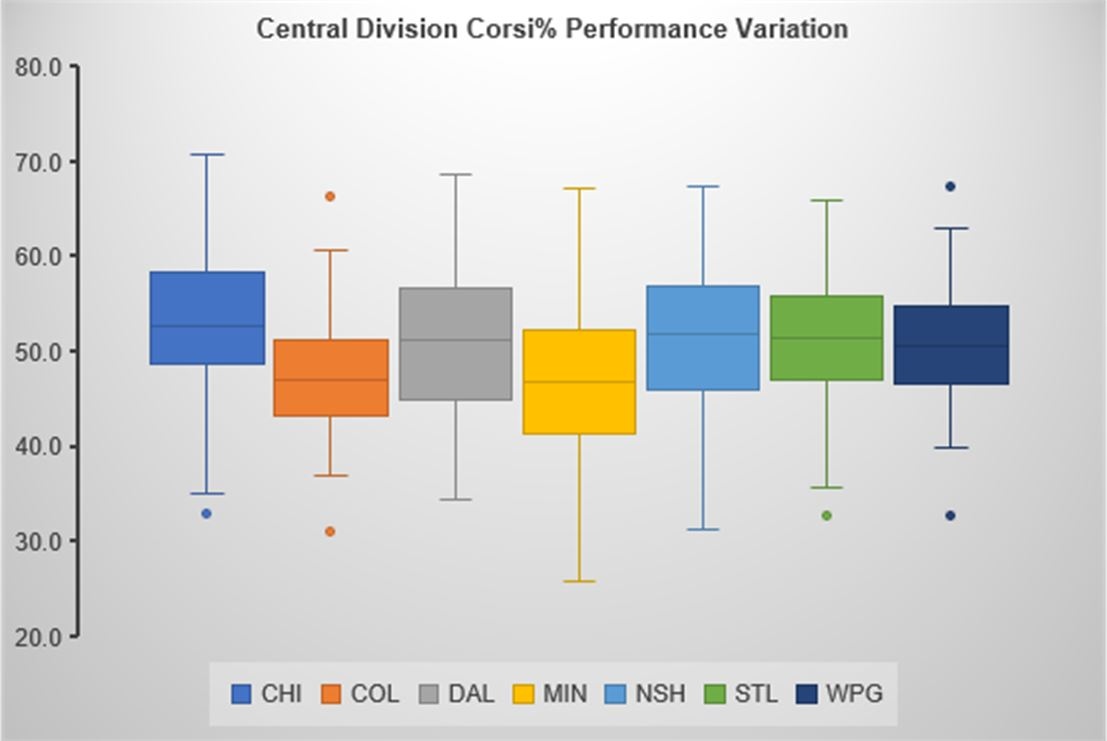
This is an interesting division. For the most part the distributions within Central teams are tighter – Colorado and Winnipeg in particular have far less volatile performances game-to-game than most of the other teams around the league. Minnesota, though, is a different story. Against Winnipeg in October, they outshot the Jets at a ridiculous 49-24 margin. A month later they were on the wrong side of the league’s biggest beating – that ill-fated December matchup referenced earlier against Tampa Bay.
One thing I will note – Nashville could be an interesting rule exception here. Though they look pretty unpredictable game-to-game, a lot of that has to do with the fact that they were a very average team to start the year and have since took off, mercilessly pounding team after team for about two months now. Their trended performance is a linear line upwards though, and if you subset the data here to the last 40 games, I’m guessing Nashville would be the least volatile (and most dominant) team in the league.
Lastly, the Pacific:
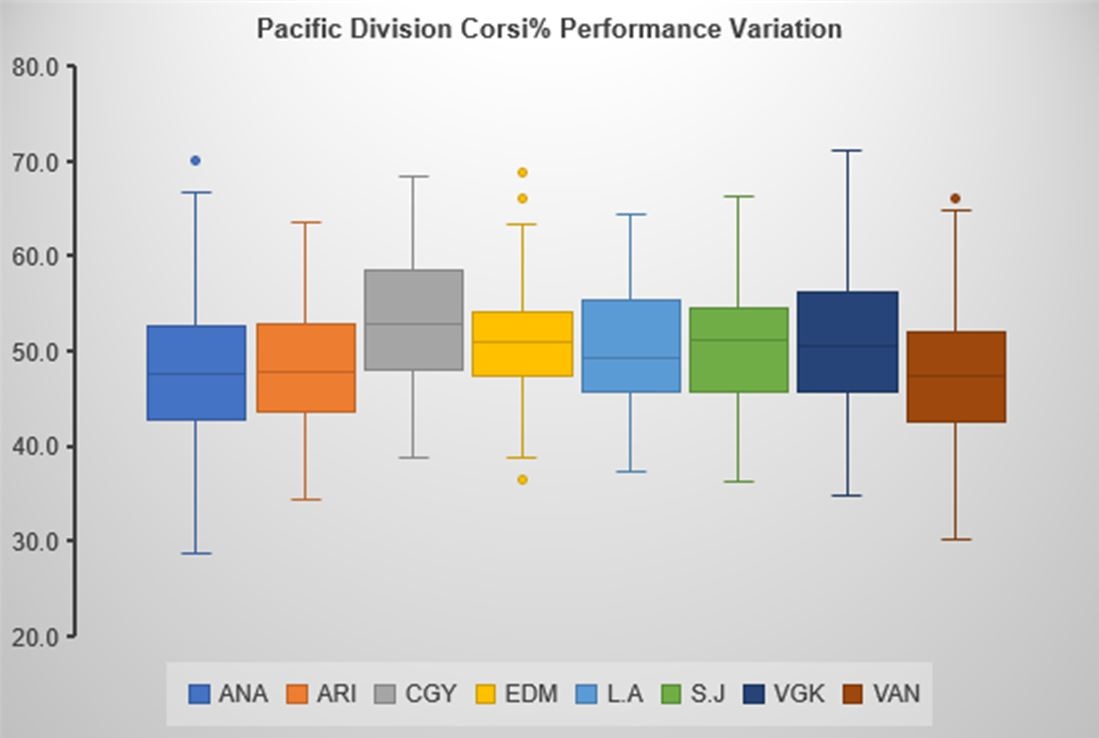
It’s kind of scary how similar many of the teams are in this division. Anaheim, Calgary, Edmonton, Los Angeles and San Jose really do have comparable year-to-date performance (Arizona also would appear similar, but keep in mind they’ve been trailing in the vast majority of games played this year). At the extremes though Anaheim is much more disparate – they have turned in some amazing games and have been torn to pieces in others.
I would be remiss to not conclude with some final words on Calgary. Why is a seemingly strong 5-on-5 team fighting for their playoff lives? There is no easy and obvious answer like there is in Carolina, but a lot of it comes from overtime and shootout. Some 27 per cent of the games they have played have escaped past regulation, which hasn’t allowed Calgary to create much separation with other Western Conference teams. Also not helping: A 2-5 shootout record so far this season.
I’m skeptical Calgary doesn’t have one of the eight best rosters in the Western Conference. But, right now, they sit on the outside looking in. And it’s looking more and more like they have squandered a real opportunity to advance past game 82.